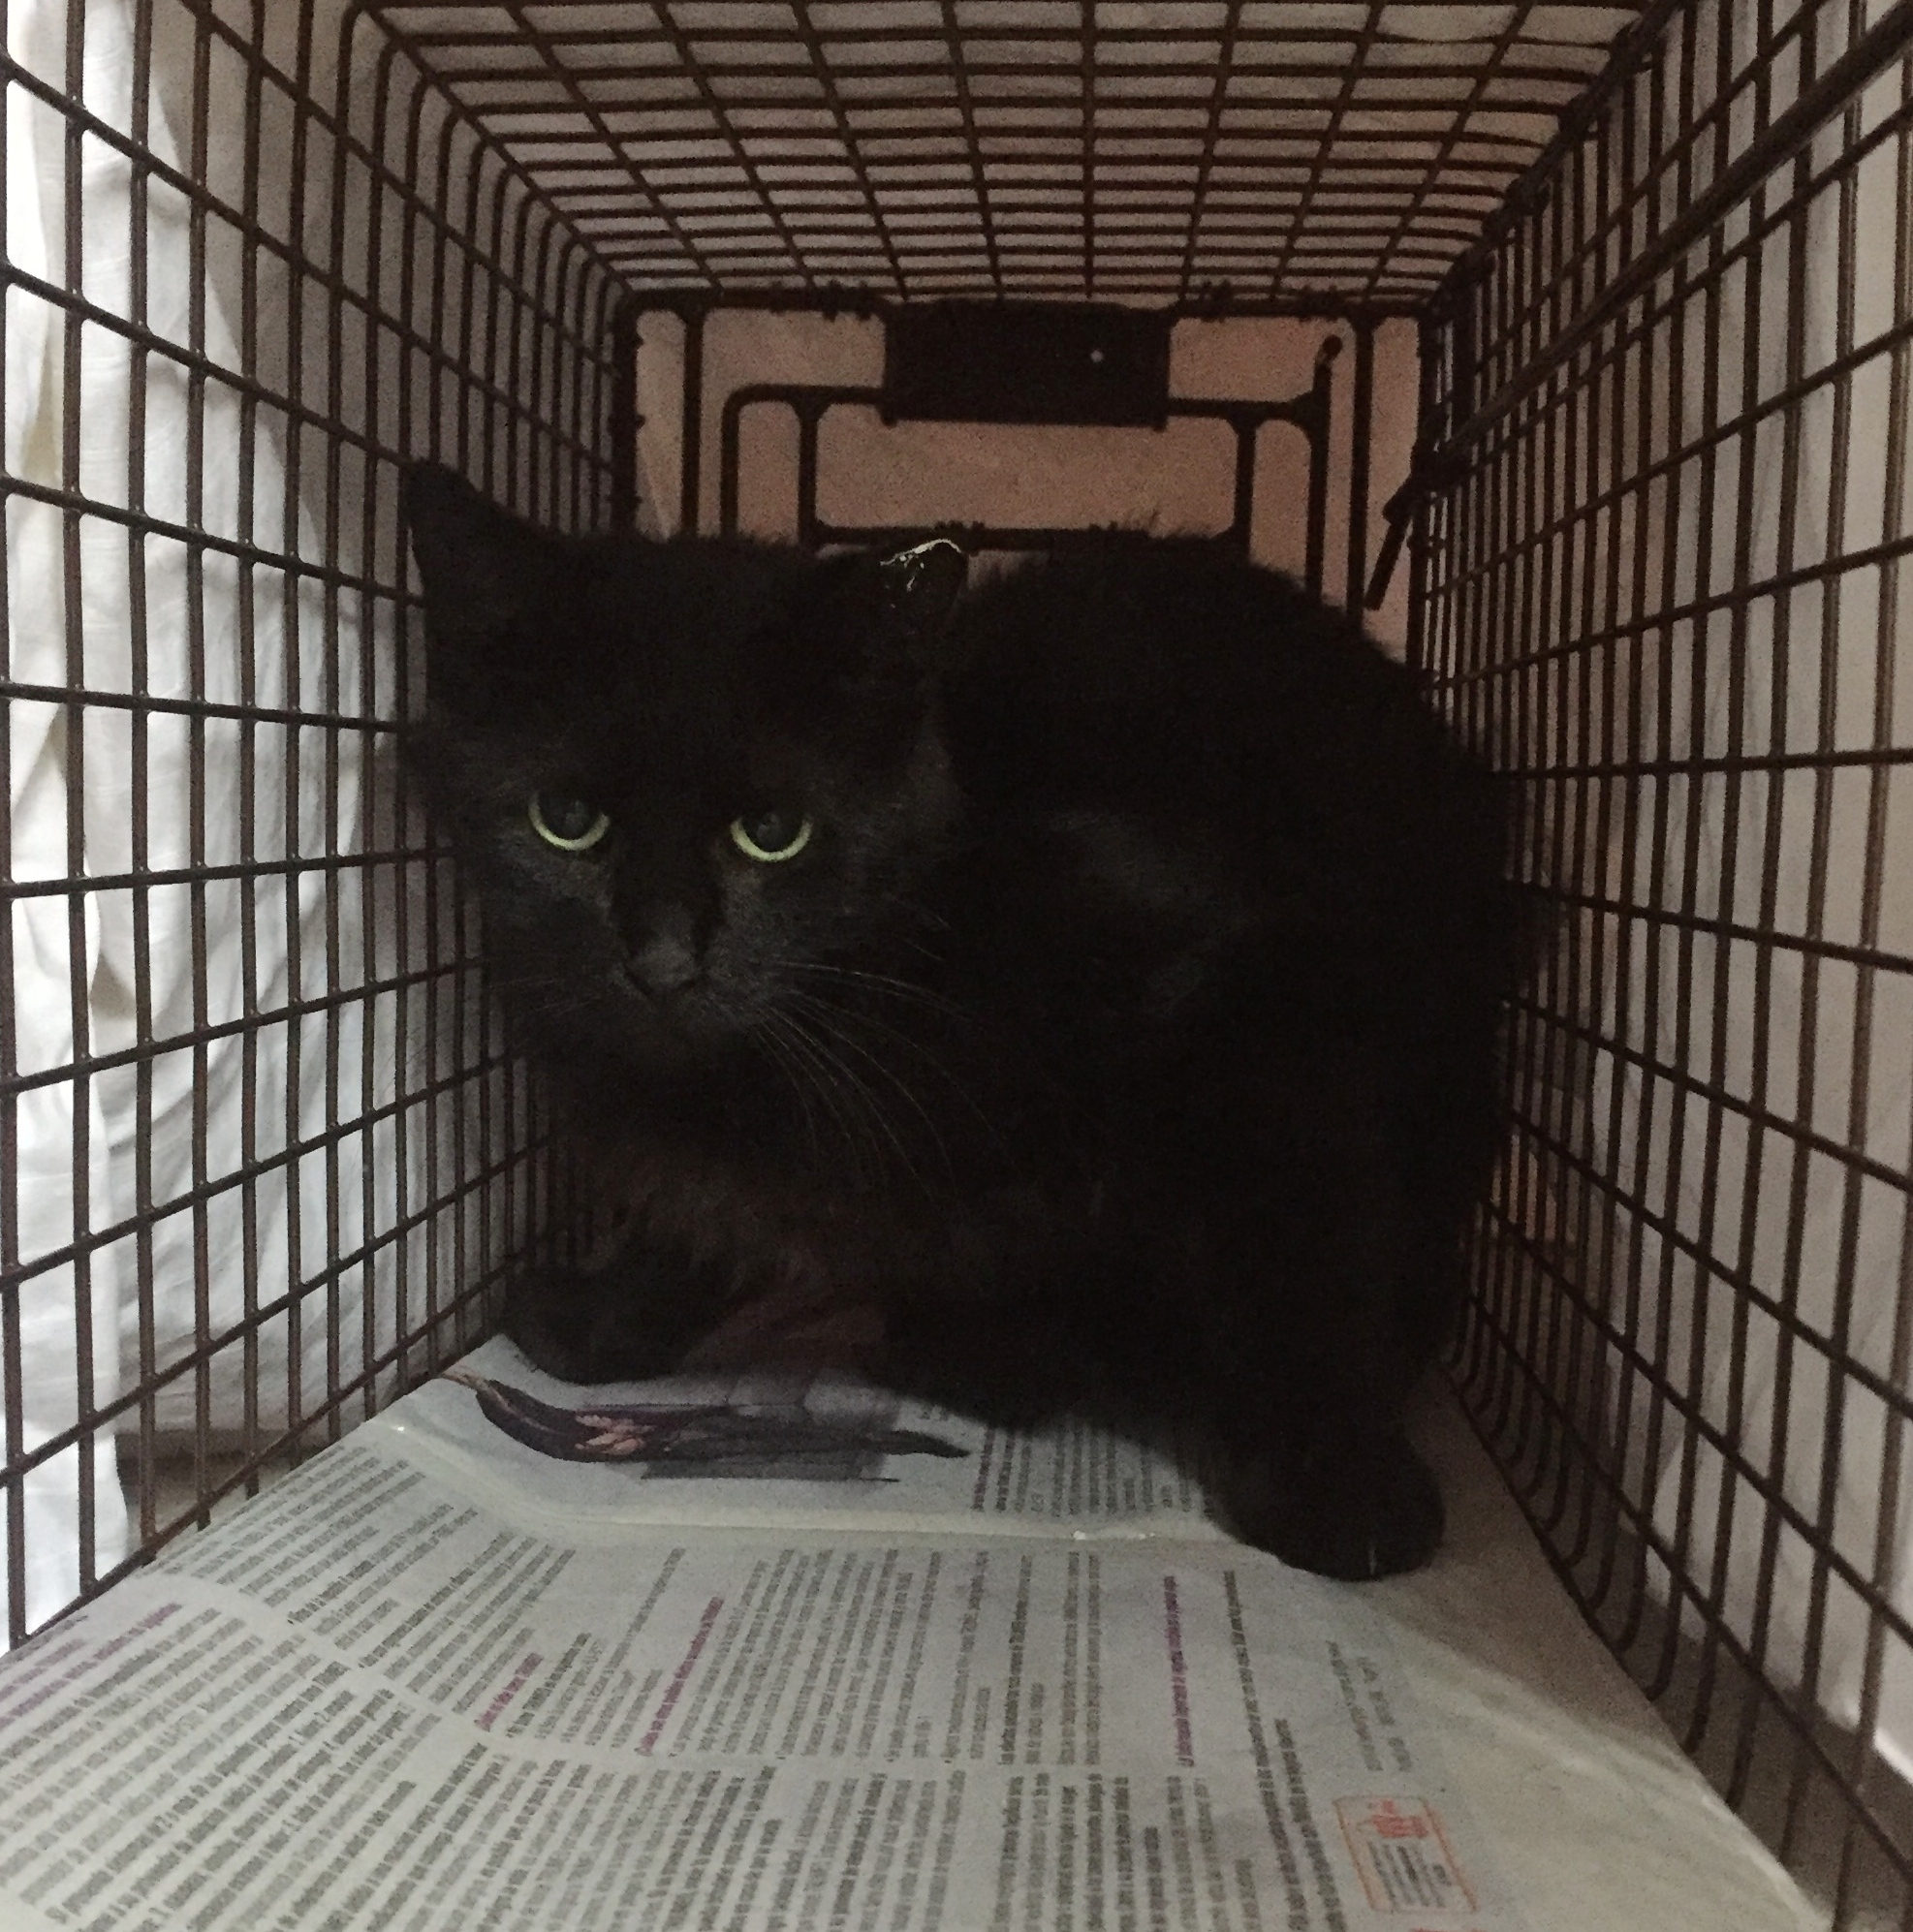
If he didn't become friendlier in the next few days, after getting his shots, he'd have his ear notched as a "feral." Then they would release him, within a mile of our address.
This new policy got the county out of the sad business of euthanizing cats. Instead, they released spayed or neutered "community cats" back into the neighborhoods where they were found, as their little pamphlet explained.
"A healthy body weight shows that the animal has a food source," it said. The food source being small birds, frogs, lizards and other small animals who might have done better had their habitat not been stocked with extra predators.
And if some community cat is a poor hunter and can't maintain his body weight, but quietly starves in the woods somewhere, no one has to feel sorry or guilty about it.
If the black one shows up again with his ear notched, I'll find a way to feed him.
This policy is actually better than the last, at least giving the animals a chance to live. It's not that different from the way we treat unwanted humans- those millions who reached adulthood with no education beyond a high school diploma and no special skills.
In a global labor market where jobs are more mobile than workers, wages for unskilled labor fall or rise toward the global average- regardless of local living standards.
That average might be a living wage in Thailand, but will leave you in abject poverty in the U.S. You won't be allowed to starve, or go entirely without medical care. But you won't thrive or even feel secure in your situation.
"Hope starts here" reads the sign at our sharing center. But whenever I work on the serving line, I see eighty or ninety familiar faces- people who are still poor enough, after years of assistance, to need a free meal every day. They aren't necessarily destitute or homeless. Some arrive in pickup trucks.
Conventional wisdom says these people don't want to work; they are drunkards or addicts; they're living on welfare by choice. There's some truth in that. And some are aged, chronically ill or crippled. But many are bright-eyed, energetic, courteous and helpful. I think they'd be eager for a chance at one of those legendary "good jobs"- 40 hours a week with benefits. Jobs that exist mainly in memory or in the literature of welfare reform.
Most unskilled jobs today are part-time or even temporary. You'd need two good ones to keep a roof over your head. Even if you got 40 hours a week at the local minimum wage, you couldn't really afford to rent a two-bedroom apartment, anywhere in the U.S.; it would take most of your paycheck.
If you wanted to be mobile, you'd probably pay the "car tax": owning, maintaining and fueling some kind of vehicle. And more than likely living in it.
I can imagine solutions that are a thousand miles away in political reality. I would tweak our infrastructure to make life more livable for those earning the global average wage: better public transportation, revise building codes to allow tiny houses, provide incentives to build affordable housing, raise minimum wages to reflect local living costs. And stop immigration, as long as we have significant unemployment or underemployment.
But in practical terms, volunteer work is the best anyone can do to help the desperately poor. It's better than doing nothing.
Cleaning and Scavenging
The Blessings of Hurricane Irma
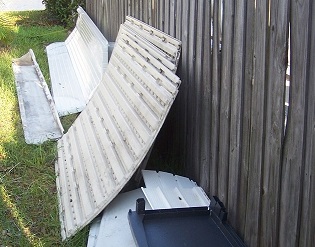
Like my neighbors, I'm happy to be alive and safe after Irma's passage. "Did you get through the storm OK?" is everyone's greeting these days. It's good to know that our island's homes and stores can withstand hours of 50 mph winds with hurricane gusts; they weren't designed for it. There was a lot of damage, but mostly to weaker structures like screen rooms, fences and storage buildings.
And we were lucky this time. Lord help those people in the Windward Islands, now bracing for their third hurricane in a week.
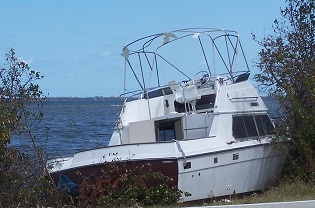
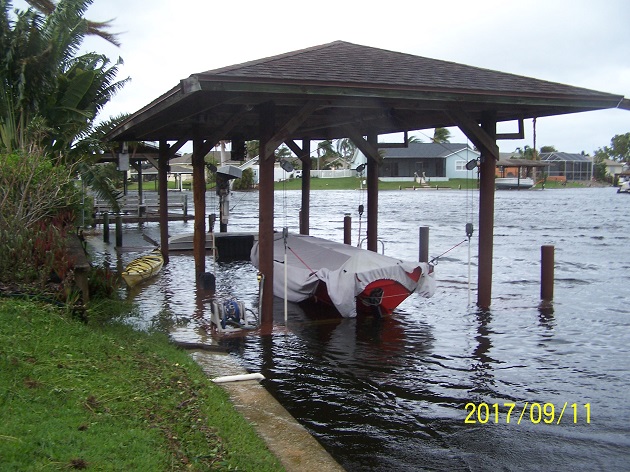
Left: Big power boat washed up on steep bank near my home
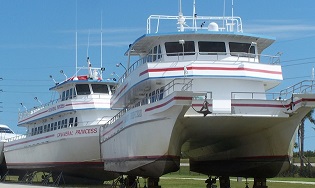
Right: Never saw these boats out of the water before! Canaveral Princess and Orlando Princess normally carry fishermen offshore of Cape Canaveral. The owners weren't taking any chances with Irma.
"Starving children in China would love to have those bread crusts," my mother used to scold. And people of shanty towns in South America and Africa would gasp to see the abundance of used construction material piled at our curbs as 'storm debris'.
For a homeowner with 3 sliding glass doors, 26 windows and only 10 hurricane shutters, it's an unexpected blessing. I could have spent thousands to protect the remaining windows, but will only need to buy fasteners (long stainless steel deck screws). And thanks to the variety of materials, I can make shutters that are lighter and easier to handle than my plywood-and-1x4 monsters.
(Boarding up is relatively simple for recessed windows in a concrete block home: cut plywood to size and mount it against the window with some jam clips. Not my windows, though- they protrude an inch out from the walls, and shutters have to be made as caps, with framing to rest against the wall.)
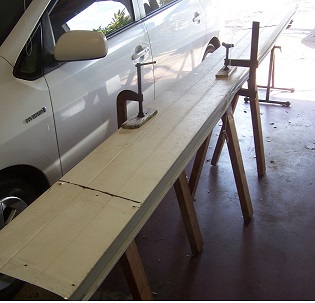
Two days after the storm, I picked up some long sections of aluminum roofing from one of numerous piles around the neighborhood. By the next day, scrap metal collectors had taken most of the aluminum, but I beat them to one trove of nearly intact aluminum roof. They arrived about five minutes after me: a young couple in a pickup truck, who helped me load a big section onto my car's roof rack. I remarked that this was probably the last pile of roofing left, but they said there was a larger pile down by Walmart. It was steel, though.
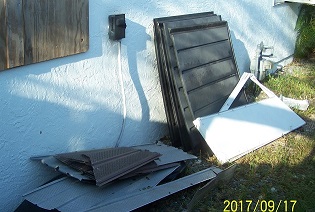
Left: Long sections of aluminum patio roof, 6' plastic fence panels, scraps of soffit
Right: Black plastic panels from neighbor's storage building; misc aluminum and plastic scrap
A few blocks away, on a street blocked by a downed power line, three full sheets of plywood were standing against a pile of tree limbs. I checked with the homeowner to make sure it was scrap, and he helped me load it.
So many fences were down, you could collect fence boards forever. And around the corner from my home, someone had put out a pile of "five-quarter" boards (1-1/4" thick), that probably had been their picnic table. It was very good for used lumber, weathered and ugly but solid.
Early on, I had gathered six foot tall plastic fence sections that my neighbors across the street had put out for rubbish; they'll go a long way towards covering my patio doors. Plus a full sized plastic door, that can be a storm panel for my balcony door upstairs.
I stored the plastic and metal in my side yard, putting the boards in the garage to stay dry. After clearing out some workspace, I sorted and brushed off the lumber, pulling out nails and nail fragments. I had 40+ feet of five-quarter in six inch widths, which I ripped into three inch width for framing.
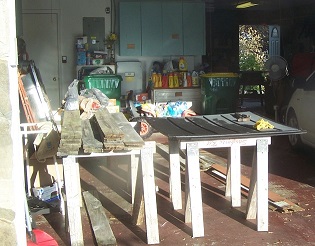
Left: Workspace in garage; boards cleaned and sorted; a plastic panel makes a table
Right: Table saw from my boatbuilding days, walled in with junk for years, now ready for action
Two sheets of plywood made four panels for some tall, narrow windows overlooking my pool deck. Though not that large, they were heavier than I liked, so I used aluminum roofing to make the next panel, for the laundry room window.
Aluminum is handy stuff; you can saw it, drill it and fasten it almost like wood. I cut four sections from individual roof channels, smoothing out the dents by clamping between sticks of one-inch lumber. Not perfect, but smooth enough that I could get them to join at the edges, with patience and a rubber mallet.
Left: Plywood panels for tall windows, fence board stiffeners on front; two panels at left look like one
Right: Aluminum roof channel, clamped for cutting. After hacksawing the edges, a skilsaw can cut the flat part.
I mounted the little roof on a frame of light fence boards, of half-inch thickness- not a good choice. I put short battens over the roofing and drove 1" deck screws though the whole sandwich, the points sticking out the other side. Shorter screws just didn't seem to anchor well. The resulting panel is not quite what I wanted, but will do. I'll frame the next one with five-quarter.
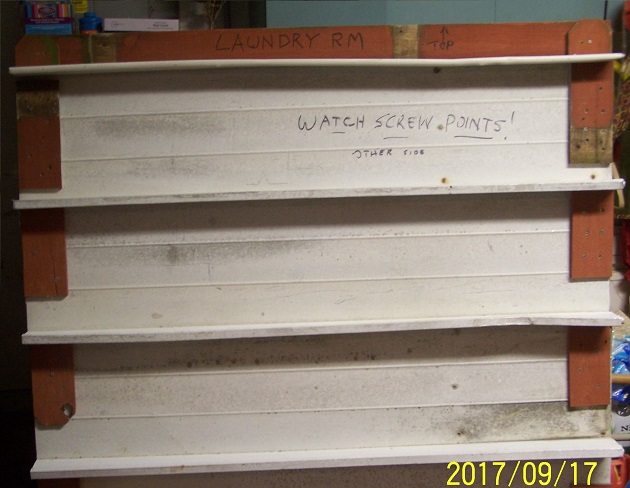
Finished panel for the laundry room window. Framing boards were too thin, but it'll work.
So I'm almost done with protection for the downstairs windows, and will start on the upstairs soon. I won't dawdle too long over the work. Jose passed us by, but there are two more named storms in the Atlantic now. One is forecast to pass just north of Hispaniola by Friday, as a category three hurricane. Where it goes from there, we'll see.
Comments
Post a comment...
All comments are moderated. I may answer flame mail directly, but will not post it unless it makes a good point.
References
Revisions to this post:
Sept 17: Revised comment about clamping aluminum channel to be sawed. It has to be clamped with the ridges down, otherwise you can't get a skilsaw into play at all.
Sept 18: Minor rewording and additions.
Cocos Obstinata
Reflections the morning after the morning after
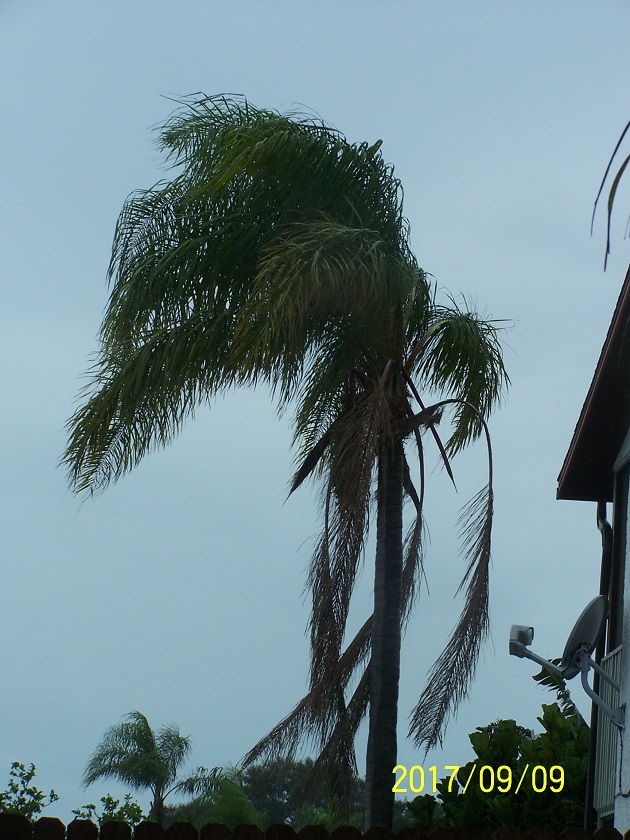
As Irma approached last Sunday, I had a frivolous complaint: not enough wind to trim my "self trimming" queen palm (cocos plumosa). The storm brought a long night of gales, gusting at hurricane force, but that palm refused to let go. Of four dead branches that needed trimming, three are still hanging on. I won't be unhappy if they hang there for a decade.
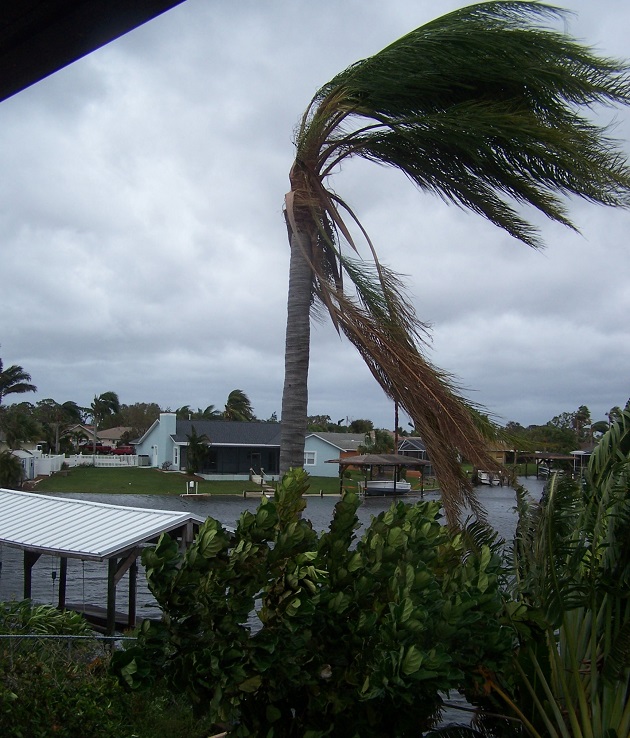
My queen palm, still untrimmed the morning after Irma.
The oak tree in front, taller than our two story house, was nearly destroyed. It may not survive. It had just been trimmed by arborists who seemed to take away half the tree- but the wind took twice as much. The remaining leaves look dead, like those on many of the shrubs, hanging limp after hours of spinning in the wind. My little queen palm in front had its crown torn off, knocking down a section of fence as it blew.
Our house sits on the outside of a bend in the street, at the end of a long north-south stretch. We must have had some channeling of the strongest winds, from the southeast. My neighbor's oak tree across the street looks quite healthy- as tall as mine, with more foliage than mine had before the storm.
Channeling can be dramatic; I recall a neighborhood where a street full of houses were hardly damaged in one storm, but the one facing the end of the street lost its roof.
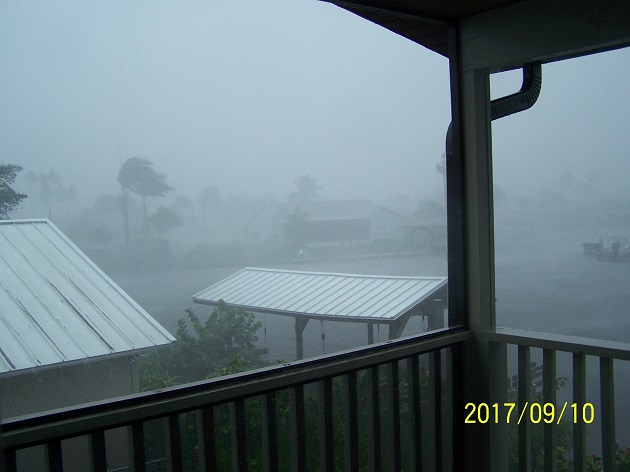
First rain band arrives, Sunday afternoon.
With two stories our house makes a nice big target. We were afraid to sleep upstairs because of the sound of sheet metal outside the unprotected windows, and a weird howling from the roof.
Trying to fall asleep in the family room, we could hear shredding noises from the fireplace as the chimney pot above was slowly destroyed.
Next day, the roof and solar panels seemed intact, but the soffit was missing from a twenty foot section. Our foam sealing of the attic may have saved the roof. If the attic had been conventionally ventilated, wind would have come in at full force after the soffit peeled off. Foam isn't designed to resist wind, of course; another night like this would probably blow holes in it along the unprotected eave.
Should we have evacuated? Probably. As things worked out, we were glad to have been here the morning after, rather than coming home to this mess 24 or 48 hours later.
My neighbors on the south have lived here since the 1980s and never evacuated for a hurricane. But Bill said Irma was the worst he'd ever seen.
We may need to evacuate yet. The power's back on- we're very lucky in that- but running water won't be restored for some days. Swimming pools have practical value at such times- thousands of gallons of fairly clean water to be dipped for washing and flushing.
But there's a limit. When pumping stations aren't pumping, you can only flush with a bucket for so long, until your feeder line fills up. I'd rather pay for a few nights in a motel than to start dumping our slops in the canal. It's dirty enough already.
Monday morning- wind driven waves were rolling up from the south, splashing into back yards. I've learned to tie off the boats before a storm so they can't float away (dock is completely under water). Second time this canal has risen over the seawall, since it was built.
PS on Wednesday: Running water is on now, low pressure and not safe to drink yet, but OK for washing and flushing. I've picked up some fence boards and big pieces of aluminum from curbside trash piles, to build more hurricane panels.
Our governor led well during the storm, telling people they had no excuse for not leaving if ordered to evacuate, speaking on TV to underscore the meteorologists' projections of storm risk. Perhaps he'll reflect later that the same corps of meteorologists is tracking and projecting the effects of global warming.
Comments
Post a comment...
All comments are moderated. I may answer flame mail directly, but will not post it unless it makes a good point.
References
Revisions to this post:
Sept 14: Added translation of "queen palm"
Calling the Turn
Uncertainties and challenges of hurricane season
In spite of all the drama shown on TV, waiting for a hurricane to pass can be almost boring. My biggest concern now is lack of wind. It's not blowing hard enough to activate the self-trimming function of my tallest palm tree. We're supposed to get to tropical storm force winds in an hour or two, building up to a maximum around midnight. Sixty knots out of the southeast should be enough to trim that tree. And the dead branches will fly northwestward across the canal, giving them plenty of time to drop to ground level before they reach the homes on the other side. No second story windows there, anyway, and the houses are all boarded up.
My "self trimming" queen palm- too tall for an extension ladder, growing in a spot you can't reach with heavy equipment.
So many evacuations. I remember running from Floyd, when the whole state of Florida seemed to be in motion. Our home was pretty secure, but we were afraid our motor home would be destroyed, so we drove across the state, stopping overnight in Apopka when the engine began to run rough and overheat.
Suspecting big trouble, I sought out a mechanic who could do engine work.
"I knowed what the problem was when you pulled in here, a hissin' and a-spittin'," he said, opening the hood. "Look here." He pulled on the throttle rod and the water pump pulley flexed in and out. He was an amateur pilot; pictures of an immaculate J-3 Cub decorated walls of his corregated iron shop.
As he was tightening the last bolts on the new water pump, tropical storm winds set in, slamming the shop doors and bending the palm trees outside. We continued on west to a campground in Crystal River, as far as we could get from Floyd's predicted track up the east coast.
But Floyd barely touched the state, turning north and tracking far offshore along the east coast. An angry weatherman in Miami couldn't believe the official forecast. "I called the turn!" he protested. "Why didn't they pick up on it?" As it turned out, millions evacuated needlessly, including us.
I don't have the explanation, but forecasters were working with an array of relatively new tools, including Doppler radar and extensive satellite imagery. Maybe the analysis techniques hadn't caught up with the new instruments.
I've never hesitated when evacuation orders came out. We hear them more often now, living on an inner barrier island. This time we were well prepared to evacuate, and also prepared to return and live without electricity for a few days. But I waited till near the end of the mandatory evacuation period, just to see.
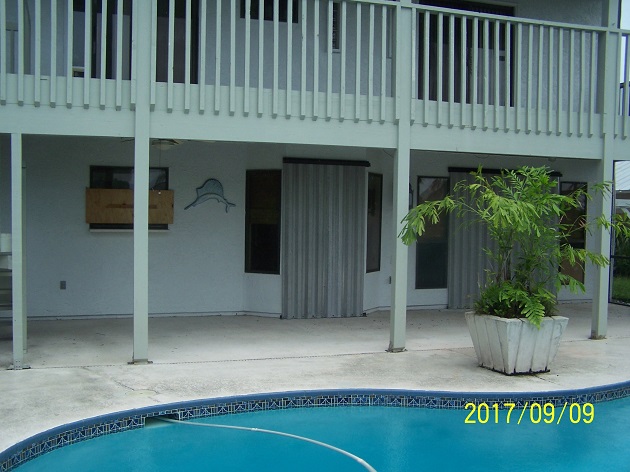
Some new shutters on my pool deck. I'll be installing more. This side of the house used to have some protection, until Matthew blew the screen room away.
I had planned my route on an old fashioned paper map. No GPS would consent to the roundabout way I planned to go, avoiding the interstates. Florida has a dense road network, once you get across the St. Johns, and there are lots of ways to get from A to B. I'd much rather be moving toward my destination at 40 mph than stuck in gridlock, idling away my fuel.
Like so many times before, a hurricane was approaching through the Bahamas and the Florida Strait, heading almost due west, and forecasters kept predicting a turn to the north. First the track was going to go up the east coast. Then it was to go right up the middle of the peninsula. Thursday night, midway through our evacuation window, the predicted track was still edging west.
A hurricane moves almost passively, like a deep eddy in a flowing river. Forecasters reason from the pattern of the river's flow and the pressure field that generates it. Both patterns are three dimensional, changing drastically with altitude. It's a difficult problem to analyze. We get excellent, detailed forecasts, that change with every update.
Saturday morning, I kept working on shutters and cleanup, and waited for the 11 AM update. By then, our chances of hurricane force winds were down to 10%, lower than any place we could reasonably evacuate to. At my brother's home in Gainesville, where we had planned to stay, there was a better than 50% chance of hurricane force winds. So we stayed home.
I talked with my brother late last night about the plate glass windows in his drugstore. He had plenty of scrap plywood, and they wouldn't see strong winds until the following evening. With some timber and fasteners, they could have protected at least the south facing windows.
But that's probably not worth doing now, because the track has shifted further west, and their chance of hurricane force winds has dropped to a few per cent.
Our biggest risk now- unless Irma makes a turn back to the east- will be tornadoes embedded in the rain bands. We've started to get tornado warnings, the weather radio sounding its alarm now and then to announce another severe thunderstorm being monitored. They've all been in the south end of the county so far, but the first big rain band is working its way north.
The turn has been made; the storm track is slightly west of north now. We'll be safe here if it follows the predicted path. Good luck to those on the Gulf coast.
It's wonderful to have all the information and the long advance warning of tropical storms. We've had plenty of time to prepare. And lots of practice.
We've had lots of time, too, to prepare for the coming tempest of resource deplection and global warming. A few individuals and communities have done some preparation, which they won't regret. But our government and financial leaders are throwing a hurricane party.
I've read so many predictions of financial collapse, oil industry collapse, hyperinflation and deflation, I hardly pay attention any more. Overshoot, the Seneca Cliff, etc. The predictions make sense; anyone who cares to look can see the storm coming. But no one can call the turn.
I may add to this post later. The wind is picking up.
Comments
Post a comment...
All comments are moderated. I may answer flame mail directly, but will not post it unless it makes a good point.
References
Revisions to this post:
Mortal Mugginess
Extreme Heat Stress in Florida and in the Persian Gulf
A spate of new
research warns
of lethally hot, humid weather in many regions by the end of this century- weather in which it would be dangerous even to walk outside, or turn off the air conditioning.
These are very long range projections, with all the uncertainty that that implies; it's hard enough to forecast weather a few days ahead. But they got me thinking about heat stress. We see it every summer in Florida. I always thought of it as something to be dealt with and endured, not as a danger.
This July and August, the Heat Index ("feels like" temperature) seemed to climb into the "Danger" zone every day and stay there for hours, its peak often exceeding the forecast. Could we be approaching deadly weather already? What about other, even muggier parts of the planet?
Researchers descibe this extreme weather in unfamiliar terms, usually involving the "wet bulb temperature" in degrees Celsius. What we hear in daily weather reports and forecasts is the Heat Index, in degrees Fahrenheit. How do these measures relate- or do they? Here's the official NOAA chart of Heat Index values:
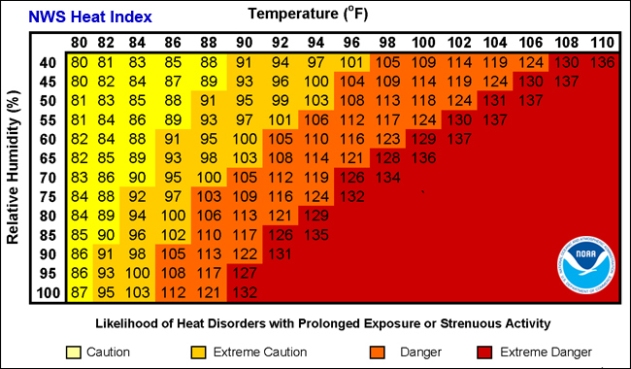
Official NOAA chart of the Heat Index: How the combination of heat and humidity feels to a person wearing a short sleeved shirt and slacks, walking at 3.1 mph in shade. Direct sunlight can make you feel much hotter, up to an additional 15 degrees Fahrenheit.
Calculating the wet bulb temperature for each cell of the chart (Note 1), you see the same pattern in both measures. They line up so well you could estimate one from the other with fair accuracy, even though one is a physical measurement and the other is based on experiments with human subjects reporting how hot they feel. Both are measuring heat stress.
"Danger" on this chart means "Heat cramps and heat exhaustion are likely; heat stroke is probably with continued activity." Crossing into the "Extreme Danger" zone, "Heat stroke is immiment."
Potentially lethal wet bulb temperatures fall in the lower right corner of the chart above, deep in the "Extreme Danger" region where no heat index values are shown. The "Danger" zone values we felt in July and August were a lower order of danger.
What is a "lethal" wet bulb temperature? The value usually cited equates to 95 degrees Fahrenheit, midway between your body's internal temperature of 98.6F and average skin temperature, about 91.4F. In this range, it's already so hot that your body can only cool itself by sweating (details
here.) Wet bulb temperatures of 95F and higher cover about half of the "Extreme Danger" zone. The transition from "Danger" to "Extreme Danger" comes at a wet bulb temperature of 86-88F.
When wet bulb temperature reaches 95 F, you can't even cool your skin to its normal temperature. Six hours of this, even resting in shade next to a fan, is fatal. With a wet bulb temperature around 91F, you can just barely cool yourself by sweating.
With a wet bulb temperature around 91F, you can just barely cool yourself by sweating. Why? Wet bulb temperature - "Tw" - is read from the wet bulb (surprise!) thermometer of an instrument called a psychrometer, during routine weather observations. The psychrometer cools its wet bulb by evaporating water into the surrounding air, just like your skin. Tw is the lowest temperature it can cool its wet bulb to under current conditions- and likewise the lowest temperature you could cool your skin to. Tw isn't usually reported, but is used to compute other humidity measures.
Florida gets unusually high Tw's, but some other regions are even muggier. The maps below show the highest daily maximum Tw from 1979 thtough 2015. The highest values occur over water surfaces- the Persian Gulf and the Red Sea. Lesser hot spots are found along the shores of the Indian Ocean, in the South China Sea and the Phillipine Sea, as well as the Gulf of California and the Gulf of Mexico. On land, the highest values are found in major river valleys of Pakistan, India and China; also the Mississippi valley and the Parana valley of Argentina (not shown).
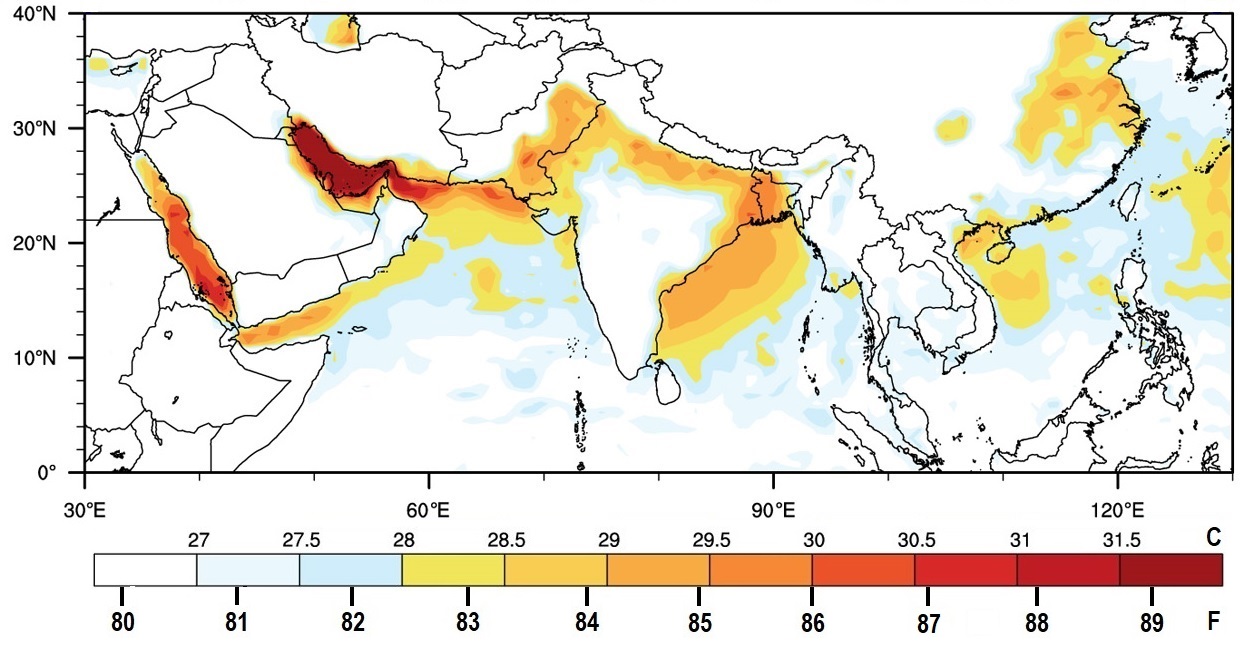
From figure "Spatial distribution of highest daily maximum wet-bulb temperature, TWmax (°C), in modern record (19792015)", in Science Advances article referenced below. Published under a creative commons license. This is the inset map from the figure, with the color scale. I've added degrees Fahrenheit below the scale.
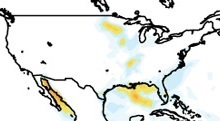
Continental US from the same map, enlarged, with same scale. South America not shown.
The Persian Gulf has been extremely hot this summer.
On Weather Underground's map of sea surface temperatures (
here)
, it has been showing up bright white, which on their color scale means temperatures over 94F- far higher than anywhere else on the map. Checkng the morning reports from a number of stations in high Tw regions, over several days, I found a few reports over 91F around the Persian Gulf.
Scanning the years records for seven stations around the Persian Gulf, from NOAA's
archive,
I found Tw values over 91F at four stations on several different dates in July and August (Note 2). Two reports were over 93F. The longest periods of Tw over 91F were seen at Kish Island, Iran and Bushehr, Iran, both on August 19.
Kish Island lies off the south coast of Iran, with hundred-mile stretches of open water on three sides. Humidity started to build up about 2:00 AM, when the overnight low temperature of 91F was reached. Haze appeared at 6:00 AM and persisted til 1:00 PM, under light, variable winds off the Gulf. Tw rose gradually from a low of 87F at 2:00 AM to a peak of 93.7F at 8:00 AM, when the air temperature reached its high for the day, 102F. From then on, both temperature and Tw declined until 8:00 PM.
At Bushehr, on a peninsula extending west-southwest into the Persian Gulf, Tw was 91F or higher at 9:00 AM, noon and 3:00 PM, cooling in late afternoon but rising over 91F again by 9:00 PM. Observations here were at 3 hour intervals.
A news report also showed a peak Tw of 93F in Jask, Iran on June 27. Jask is on the Gulf of Oman, east of the Persian Gulf.
These were probably the highest Tw values observed on Earth this year, so far. Not lethal, but at or above normal skin temperature, well into the "extreme danger" zone of the heat index.
Higher values have been recorded. During a heat wave in early 2015, Mahshahr reached a wet bulb temperature of 93F one day, followed by a peak value of 94F the next. Mahshahr is near the north coast of the Persian Gulf. Dhahran, Saudi Arabia on the southwest coast experienced a Tw of 97F on July 8, 2003.
Iranians are familiar with the hot, humid air of the Persian Gulf. When it blows their way, it's called "Sharji." Sharji is completely normal weather, as engineer Peyman Fatemi described during the 2015 heat wave:
On Thursday in Mahshahr, we went out for shopping and eating with friends at 7 p.m., when the weather was humid but less hot than noon. Streets were crowded as usual.
Our whole skin and shirts got completely wet very quickly say in less than five minutes but it is normal and is a matter of taking a shower afterwards, Fatemi said. People also drink a lot of cold water, soda-based drinks, malt beverages and so on. Most people carry a bottle of cold water, juice, everywhere.
..it is very difficult to walk under sunshine between 11 a.m. to 6 p.m. in summer for more than 15 minutes without resting in a shade and drinking a heavy load of water and pouring it over your head.
What surprised Fatemi about this spell of Sharji was that it happened in early August. Sharji normally comes in September, when prevailing southwest winds blow onshore from the Gulf. But this was a heat wave, like the ones reported in July and August this year, when ridges of high pressure dominated the region's weather. (Punctuated by rare thunderstorms in Doha on August 15.)
An Israeli columnist, Adam Berkowitz, speculated that this year's heat waves were divine punishment on Iran for sponsoring terrorism against Israel. He quoted scriptures telling how god had sent heat waves as retribution:
"For behold the day cometh it burneth as a furnace; and all the proud and all that work wickedness shall be stubble.."
"And thy heaven that is over thy head shall be brass, and the earth that is under thee shall be iron."
Berkowitz could broaden his vision a bit. These heat waves affected the whole Persian Gulf region, not just Iran. As I write, Southern Europe is suffering a severe heat wave, as is the US southwest. Houston is recovering from a devastating hurricane, while another stong one is building in the Atlantic. If Jehovah's hand is in this, he may be punishing us all, for our poor stewardship of Mother Earth.
Note 1: Wet bulb temperature "Tw" can be calculated from temperature, atmospheric pressure, and a measure of humidity- either relative humidity or dew point temperature. I calculated values for every cell of the Heat Index chart using average sea level pressure, 1013 millibars. (Full chart
This makes sense because Tw depends only slightly on pressure. Pressure differences like those of day to day weather changes will change calculated Tw only by hundredths of a degree. The difference between sea level pressure and typical pressures in Denver or Breckenridge will move it perhaps half a degree Fahrenheit. And the places where Tw gets really high are near sea level.
"An adaptability limit to climate change due to heat stress"
Steven C. Sherwooda,1 and Matthew Huberb, 2009,
Proceedings of the National Academy of Sciences of the United States of America,
http://www.pnas.org/content/107/21/9552.full
Choosing Your Ride
Beyond convenience: fuel economy, emissions, traffic congestion, taxes..
In a recent post I extolled public transit as a way to cut personal fuel use, emissions and expenses, for those few Americans who can use it. But I had to think hard about that view after reading two well reasoned rebuttals, from
Paul
in Madison, Wisconsin, and
Vince
in Austin, Texas.
Vince pointed out that transit buses use more fuel and generate more emissions per passenger-mile than automobiles, and recommended car pooling as the best all-round approach for most Americans. Paul decried the inconvenience of using public transit, and noted that it was mostly financed by taxes rather than fares.
Both readers said average car ownership expenses were higher than necessary, exaggerating the "Car Tax" (the nearly mandatory expense of operating an automobile.) Paul concluded that car ownership wasn't that much more expensive than using transit- if available- and was well worth the extra cost. Vince reported his auto expenses, commuting in a 1995 Oldsmobile, as much lower than any transit alternative.
Let's look at these points in detail, with this key question in mind:
What's the best transport choice for an individual American who wants to make the necessary trips but also wants to conserve fuel and reduce emissions- without moving house, without selling or trading cars, using the existing road network and existing transit systems?
Obviously, most of us need access to an automobile for the daily necessities of life. A few can get by with walking or cycling. A minority, in major metropolitan areas, can use extensive public transit systems with frequent, reliable service. Outside those areas, many cities have transit systems, usually bus lines, providing limited service.
Transit buses use more fuel and generate more emissions than passenger cars or personal trucks, on a passenger-mile basis, as shown in the following table. (Emissions are not shown here, but fuel use is a close analog.)
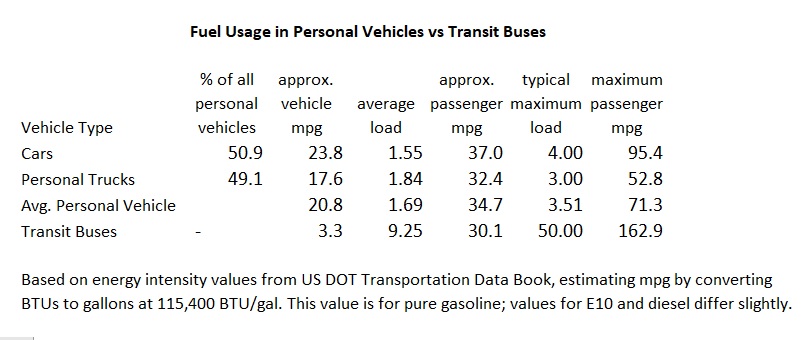
The light loading of transit buses- nine passengers on average- kills their efficiency. Loads were higher in the 1970s and 1980s, averaging 12-13 passengers. If buses were always fully loaded- in some hypothetical world- they could achieve about 160 passenger miles per gallon (Note 1). But an average car with four passengers- typical for commuters in a car pool- gets around 95 passenger-mpg.
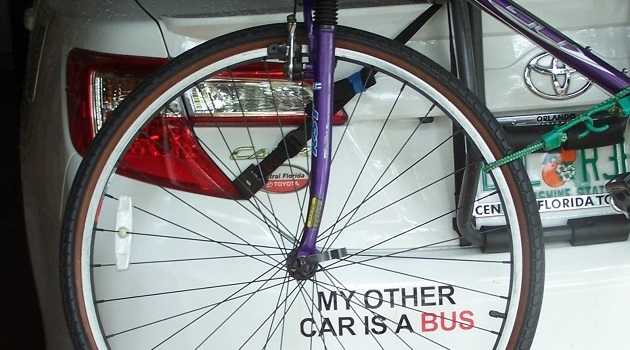
Car pooling takes significant organization, but is a vast improvement over driving alone (like 90% of auto commuters today). And it's potentially available to every auto commuter. It eliminates travel to and from the transit stop, saving some trouble during bad weather. Vince called it "..the absolute cleanest, most efficient and economic mode of commuting.."
But if you can conveniently use public transit for a given trip- whether to work or some other errand- it makes an even better choice. A scheduled bus is going to run, whether you ride it or not. If you choose it over your automobile, you save all the fuel you would have used and the emissions you would have generated. With one more passenger, the bus will burn a little more fuel, but only a tiny fraction of what your car would have burned.
If you choose public transit over a car pool, the same considerations apply: you're saving a large fraction of the fuel the car would have used and the emissions it would have generated, at the cost of a minuscule increase in the buses' fuel use.
This logic only fails if you happen to be that one additional passenger who convinces management to put a second bus on the route. It's highly unlikely- there's always room for jello, and for one more passenger on a transit bus. In actuality, buses tend to be lightly loaded, and every additional passenger makes them more efficient per passenger mile.
Both car pools and public transit help to reduce traffic congestion. The bane of the traffic engineer is the single occupant vehicle. A bus passenger, with his "share" of the buses' footprint, takes up 4 times the space of a pedestrian on the roadway. A parked car takes up 70 times as much. (For moving vehicles, the multiples increase.)
Buses cause more wear and tear on highways than cars, but if a large segment of auto commuters changed to public transit (or car pooling), it would reduce the need for road and bridge expansions. It may be cheaper to do extra maintenance on a six-lane highway than to enlarge it to eight lanes.
You could save a bundle by not paying the Car Tax, if you have adequate public transit. At a rough national average of $2 a ride, commuting five weekdays plus three extra round trips per week would cost you $1664 per year- a fraction of the average cost of maintaining an automobile. (An arithmetic error in my original post gave a much higher figure.)
Paul thought my value for the yearly cost of maintaining an automobile - $9,000 - was high, though it came from a well documented survey. Vince demonstrated with his own figures that he could keep his car expenses at about $1,000 a year. The national average suggests most of us don't do as well.
Several thousand makes a big difference if you're in the same income bracket as the average transit commuter in my county or in Orlando: under $15,000 a year. So does the reduced risk: if the bus breaks down, you won't have to fix it or pay for the repairs.
Are you depending too much on other taxpayers if you use public transit? On the average, fares pay for only 36% of the cost of public transit; taxpayers cover the rest.
This "farebox ratio" is better in more heavily used systems. The best in the US is San Francisco's BART system, 75% financed by fares. Some of the highest in the world, 100% or more are found in Hong Kong and Singapore, densely populated cities where nearly everyone uses the transit systems.
Our transit systems have a lot of room for farebox ratio improvement, with an average of nine passengers riding a 50-passenger bus. If the ratio is 36%, just increasing the average load to 13 passengers, like it was in the 1970s, would raise the farebox ratio to 52%. Hypothetically, if the buses were half full on average, the ratio would be 100%.
We depend on taxpayers for streets and highways, too. The average household pays about $1,100 a year in state and local taxes for road construction and maintenance. They also pay about $980 a year in gasoline taxes, mostly federal. Though there's some overlap in those numbers, if you think of gas taxes as our "fare" for using the system, the highway system's farebox ratio may be around 50%. Certainly it's nowhere near BART's. (Transit buses use the system too, of course. And pay plenty in gas taxes.)
Toll roads vary, from some that pay for themselves to others that don't even earn back the cost of collecting the tolls. I haven't found any national averages.
Is public transit too inconvenient for practical use? Maybe "inconvenient" is too mild a term. Paul complained of "..the staggering non-monetary cost of transit":
"It takes 60-120 minutes including walking, random waits and transfers with more and lengthy waits, to make a 20-minute trip. It crawls along with an interminable stop every couple of blocks. It leaves the rider drenched and sticky from hiking in blistering July heat, or, conversely, at risk of breaking bones on slick January ice."
It depends on your situation, your local transit system, and how much inconvenience you're willing to put up with. When biking or walking, the cool of the morning is a big asset. In years past, I would bike to work if there was no rain in the area, in a long sleeved shirt and slacks, and arrive after a 20 minute ride with no significant sweat. On the way home, it didn't matter if I got sweaty or even rain-soaked. I could change clothes at home.
I don't count my time walking or cycling to a bus stop as lost. If I get some aerobic exercise in the course of my travels, it's that much less time I need to set aside elsewhere in my schedule.
Ice on the sidewalks? I'll leave that discussion to the Madisonians. (Though when I lived there, I walked a mile or two to classes most days, often in an Air Force "snorkel" parka.)
In spite of the drawbacks of the transit bus, I still see small-city bus systems as nuclei that could grow in coverage and service frequency to become viable systems for commuters and shoppers. In a small way, it's already happening. In a recent survey of riders on our little county bus system, half of whom either don't own a car or can't drive, one passenger in five was using the bus for its convenience, rather than necessity.
Vince mentioned the private
"dollar vans"
that started carrying passengers in New York City during a transit strike in the 1980s, and still operate today:
"These guys operate at a profit against heavily subsidized government buses. Their customer base is mostly poor immigrants."
Maybe relaxing the laws on "common carriers" would help to promote more such systems. I wonder if the dollar vans helped inspire the Megabus private intercity bus system. It operates without official bus stops or, apparently, any real estate. Its fares start at $1, for the first passengers to book.
Note 1: In previous posts, I've cited a figure of 360 passenger-miles per gallon as a potential maximum for US buses, based on a DOT reported average fuel economy of 7.2 mpg. Transit buses, driving in city traffic and making frequent stops, get less than half that many miles per gallon. I'm not distinguishing gasoline and diesel powered buses here; the numbers are roughly similar.
Comments
Post a comment...
All comments are moderated. I may answer flame mail directly, but will not post it unless it makes a good point.
References
US Public Interest Reserch Group, "Who Pays for Roads?", 2015,
http://www.uspirg.org/reports/usp/who-pays-roads
Seattle Times, "How Much of Transit Operating Costs do Riders Actually Pay?", 2017,
http://www.seattletimes.com/seattle-news/transportation/how-much-of-transit-operating-costs-do-riders-actually-pay/
Wikipedia, "Fuel Taxes in the United States",
https://en.wikipedia.org/wiki/Fuel_taxes_in_the_United_States
Federal Highway Administration, Travel Profile of US, 2009,
http://nhts.ornl.gov/publications.shtml
Hartford Courant, "Federal Law Gives Tax Break For Transit Commuters", 2016,
http://www.courant.com/news/connecticut/hc-transit-tax-0107-20160106-story.html
US DOT, Commuting Mode Share (figure), 2015,
https://www.bts.dot.gov/content/commute-mode-share-2015
US DOT, "Overview of Transit Vehicles,"
https://www.codot.gov/programs/commuterchoices/documents/trandir_transit.pdf
Governing.com, "Public Transportation Demographics: Ridership Data for Cities",
http://www.governing.com/gov-data/transportation-infrastructure/public-transportation-demographics-ridership-data-for-cities.html
US Oak Ridge National Laboratory, Transportation Energy Data Book, 2016,
Download at
http://cta.ornl.gov/data/index.shtml
Space Coast Area Transit Rider Survey Report, included toward the end of this package of materials:
http://321transit.com/wp-content/uploads/2017/05/March-2017-LCB-Agenda-Package.pdf
Also..
Interesting study of Seattle's tranportation taxes and fees from taxpayer's point of view:
"Transportation Revenues from the Taxpayer,"
https://www.documentcloud.org/documents/2435460-transportation-revenues-from-the-taxpayer.html
Contrary view from another Paul in Madison, "Do Buses Save Gas?", 2008,
http://www.thetruthaboutcars.com/2008/02/do-buses-save-gas/
Revisions to this post:
August 6: Added note about exercise,link to SCAT rider survey.
August 9: Rewrote paragraph "Could you save a bundle.." after correcting some bad arithmetic in my original post. Annual cost for 10 rides a week with a $2 fare would be $1040, not "$3650". Paul's comment on transit expense was based on the erroneous figure.
Previous Post:
From Inferno to Purgatory
Home